You have been dreaming of going to the Top of Europe for decades. But the weather app shows a cloud with a raindrop.
Do you change your plans, or do you go anyway?
Maybe you will be staring into fog for three hours and have wasted 200+ bucks on nothing.
After living in Switzerland for 25 years, here is what I can tell you:
Weather in Switzerland is complicated
That icon does not always mean “it will rain.” Switzerland doesn’t really have one weather.
A valley can be in full sun… while the mountaintop can be socked in completely. And that can flip completely after lunch.
Those “weather apps” you are using aren’t built for Swiss weather.
👉👉 SEE MY MUST HAVE APPS LIST
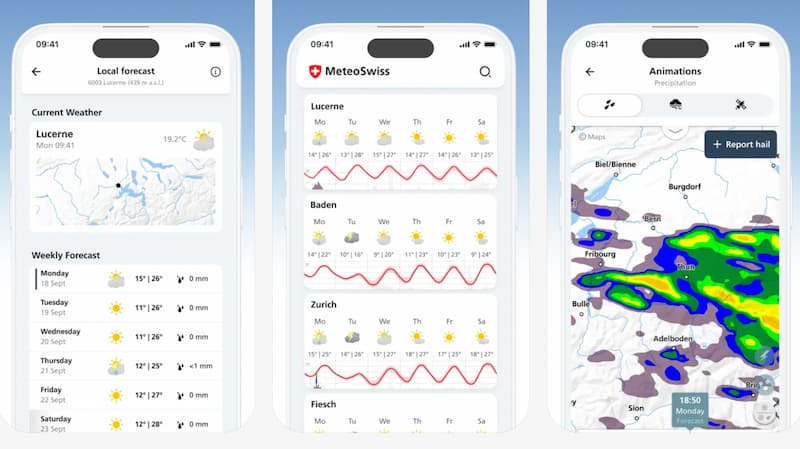
MeteoSwiss, the country’s own forecasting service, is, but only if you know how to look past the icon.
Below is exactly how to read it, using a real forecast for Zermatt as the example. 👇👇👇
1. The week view is a rough sketch, not a plan
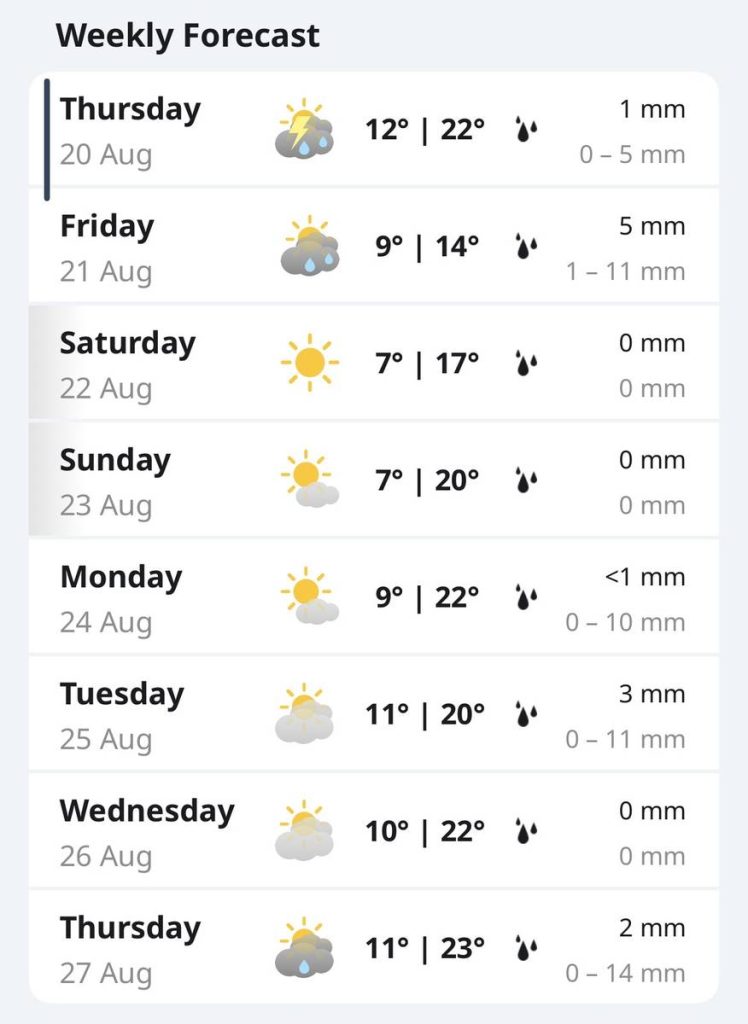
Open the app, and the first thing you see is an 8-day overview: an icon, a high and low temperature, and a millimeter figure for expected rain. (1mm = 1/25 inch, yes they are tiny)
Treat this as a heads-up, not a forecast to book against.
Notice the grey numbers next to the black ones. Those are the extreme-case range, with the expected number showing in black.
A day showing “3 mm” might really be “0 to 11 mm,” which is a totally different bet than a day showing “15 mm, with a range up to 25 mm.”
That spread is the app telling you how confident they actually are, and the same range idea shows up again in the hourly rain bars once you tap into a day. They show you how certain they are and what “might” happen. Don’t always treat it as gospel.
This is also why the tip below matters:
MeteoSwiss revises its own forecasts almost daily, and they sharpen up noticeably as the date gets closer. A week-out prediction is closer to a crystal ball than a plan. Don’t lock in tickets for the high mountains further out than a few days.
👉👉 READ THIS INSTEAD
2. Open the daily view for the real answer
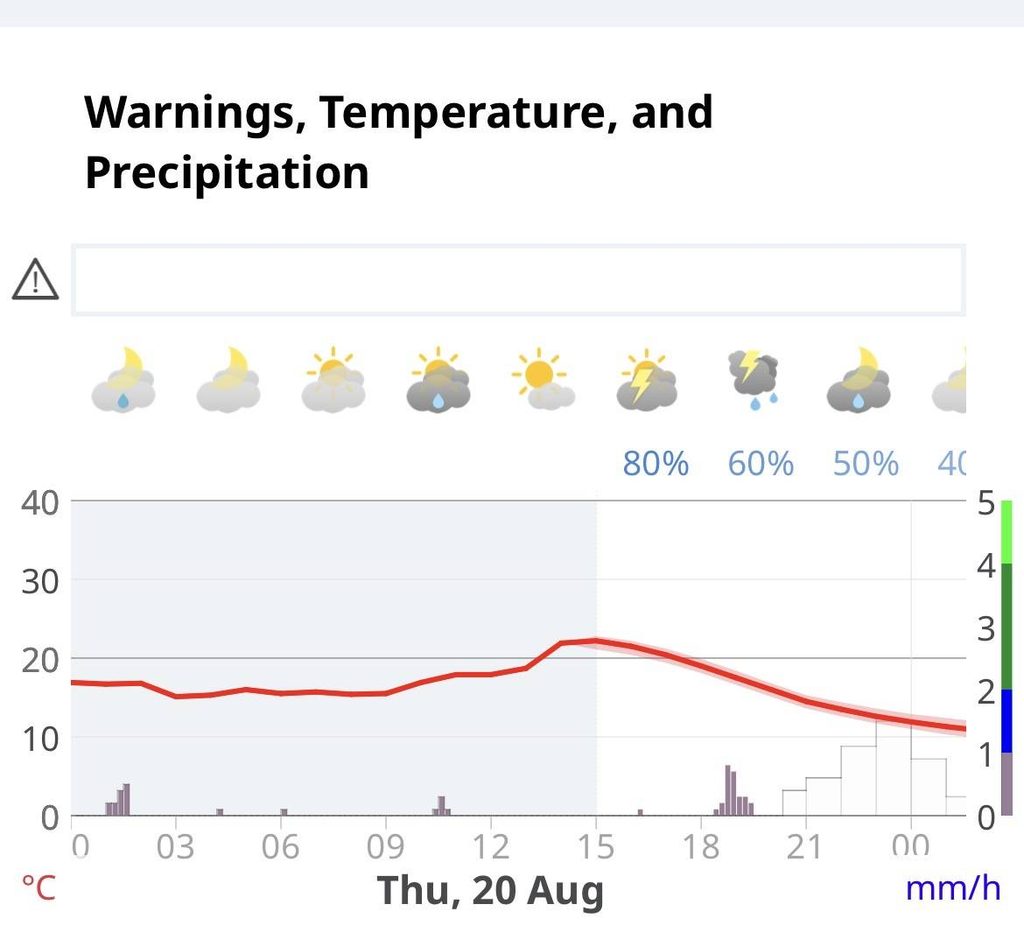
IMPORTANT: Above, note the percentage, not just the picture. AND we do hours in military time (15 = 3pm)
Tap on any day in the week list and you land on an hour-by-hour breakdown. This is the screen that actually tells you whether to go.
The hourly icons at the top show conditions for each period of the day, with a rain probability percentage below.
The above Zermatt forecast shows rain starting at 3pm, then decreasing as the afternoon goes on. So watch the cloud cover and the rain percentage to get a better image of what is going to happen.
The temperature curve is a red line with a shaded band around it. The line is the expected temperature; the shaded band is the uncertainty. A wide band means the model isn’t sure, so expect the real day to swing more than the line alone suggests. On the same sample day, the curve climbed into the mid-20s by early afternoon.
NOTE: for Fahrenheit lovers:
Want To Save This For Later?
10C = 50F, 20C = 68 F, 25C = 77F, 30C = 86F, 0C is freezing point. Anything minus is below freezing.
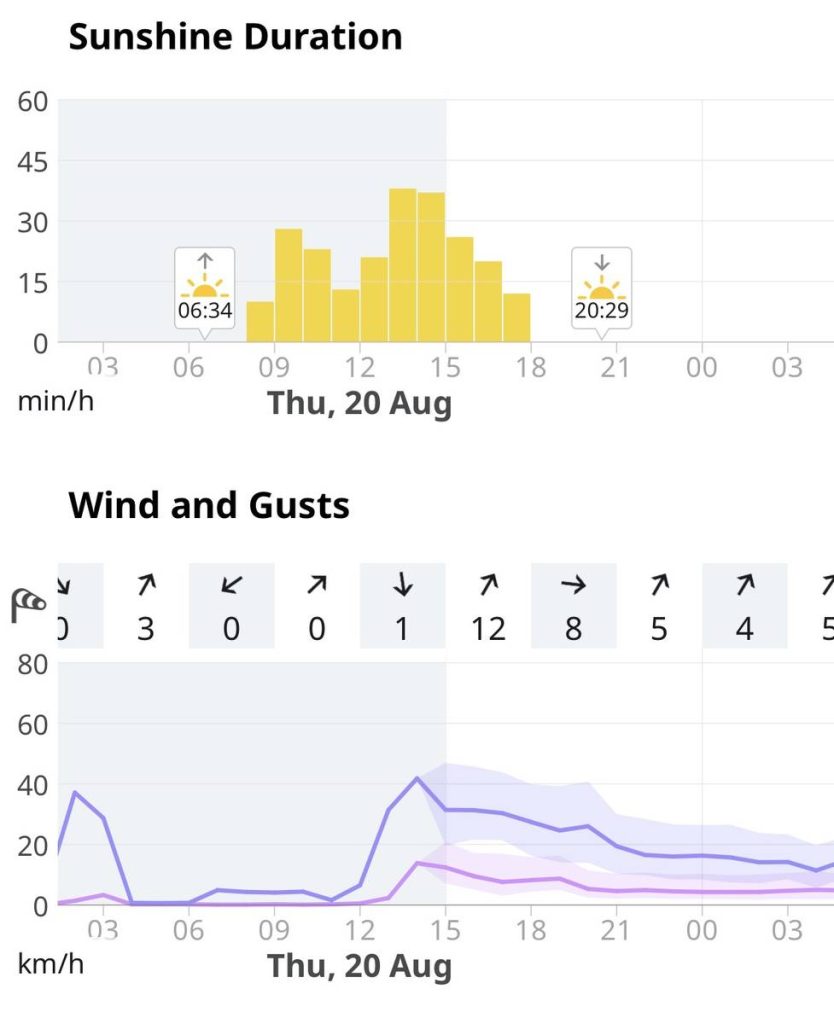
The sunshine duration chart is a bar graph showing expected sunshine minutes per hour. On that sample day, the bars built to around 30-40 minutes an hour by early afternoon, then tapered off toward sunset.
It’s a quick way to see cloud building through the day at a glance, useful for timing a summit trip before the afternoon clouds move in.
The wind and gusts graph shows direction (arrows) and average sustained speed at the top, with a graph below: one line for sustained speed, a second for gusts, and lighter shading again meaning more uncertainty.
On the above day, sustained wind stayed modest through the morning but gusts built toward early afternoon, tapering off later in the day.
This matters more than people expect at altitude. A cable car or via ferrata trip that looks fine on temperature and rain can still be a bad idea on a high-gust day.
3. The separate Animations section is your radar
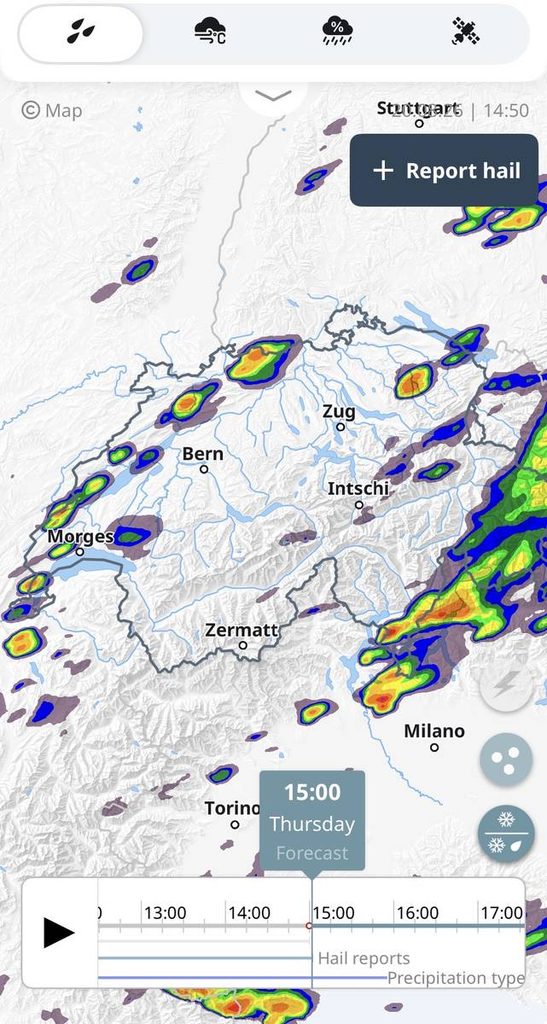
The hour-by-hour numbers on the day forcast are only half the picture.
A separate Animations section further down the main home page (not the daily view itself) shows playable animations for precipitation, precipitation type, wind, temperature, clouds, and satellite imagery, so you can watch what’s actually moving toward you over the next few hours.
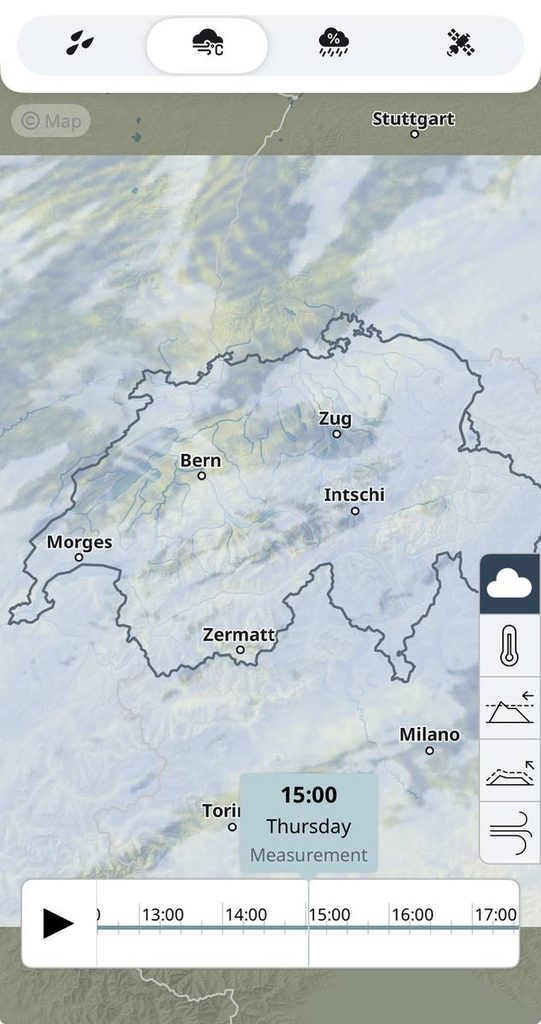
This is the closest thing to “look out the window” the app has, and it’s the most reliable piece for same-day, short-notice decisions, far more so than any forecast more than a day or two out.
What this actually means for planning a trip
If you take one thing from this: don’t buy tickets, book tours, or commit to a high-mountain day more than one to three days out.
Conditions at altitude change faster than the forecast can promise, so this is as much a safety call as it is about the view. Build in a backup plan for the days you can’t move, because Switzerland has far more to do than the handful of hotspots everyone fixates on.
IF IT RAINS 👇👇👇
👉👉 RAINY DAY IDEAS & INTERLAKEN REGION RAINY DAY
Ask locals: hotel staff, the ticket office, tourist information, or honestly anyone on the street. They usually have a read on what the sky is about to do, or know who does.
The mountains aren’t going anywhere. If the day doesn’t cooperate, that’s a reason to come back, not a reason to rush a bad window.
4. Dive deeper into the App
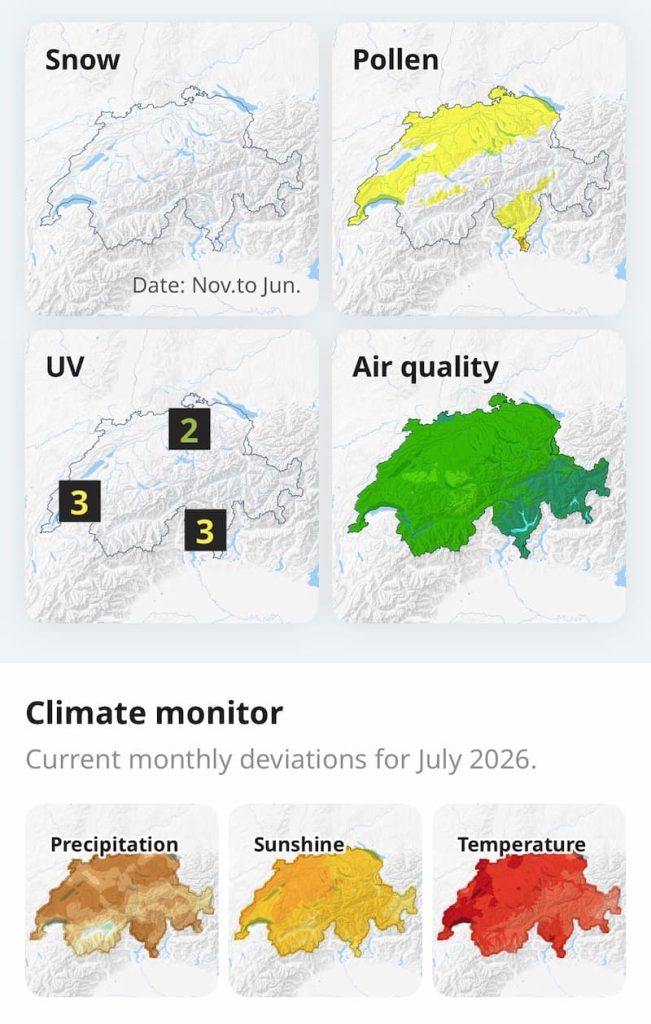
For a high-mountain day specifically, a few other sections matter as much as the basic forecast:
- Altitude-specific wind and temperature. Conditions at a ridge or summit can be meaningfully different from the valley-floor reading that everyone checks by default.
- Snow depth and fresh snow. Under the app’s Sports & Health section, useful well beyond winter for anything involving glaciers or high passes.
- Natural hazard warnings. Push-configurable alerts covering severe weather, floods, avalanches, earthquakes, and forest fires, issued by the federal authorities.
- Webcams on the map view, for a literal look at current conditions at a specific spot.
- Saved locations. The app keeps an organized list of the places you check often, and shows you the nearest forecast point if you’re somewhere between two of them, useful in a country where the forecast can change within a few kilometers.
When you go
Best use of the app: check the daily view and the Animations section (not just the 8-day list) 1-3 days before any high-altitude plan, and re-check the morning of.
App: MeteoSwiss, official app of the Swiss federal weather service (Android and IOS / Apple)
Local tip: if the week view looks mixed, don’t cancel. Wait for the daily forecast to sharpen up as the date gets closer.
Which part of the app do you usually miss, the uncertainty bands, the Animations section, or the altitude-specific readings? Let us know in the comments.